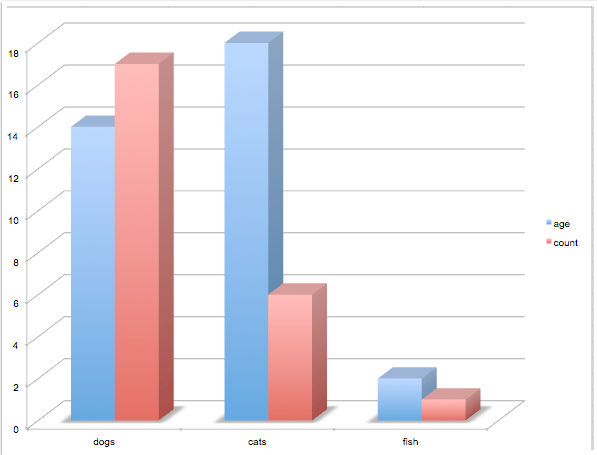
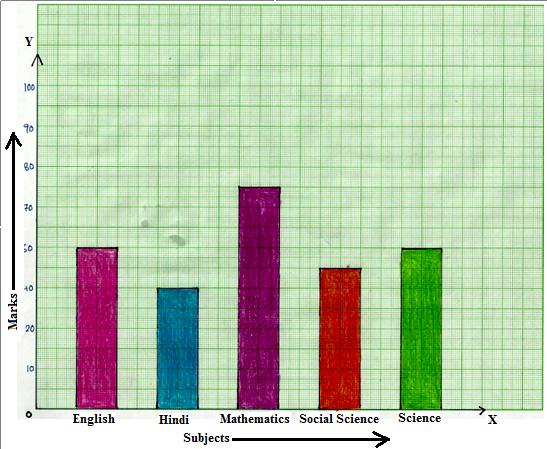
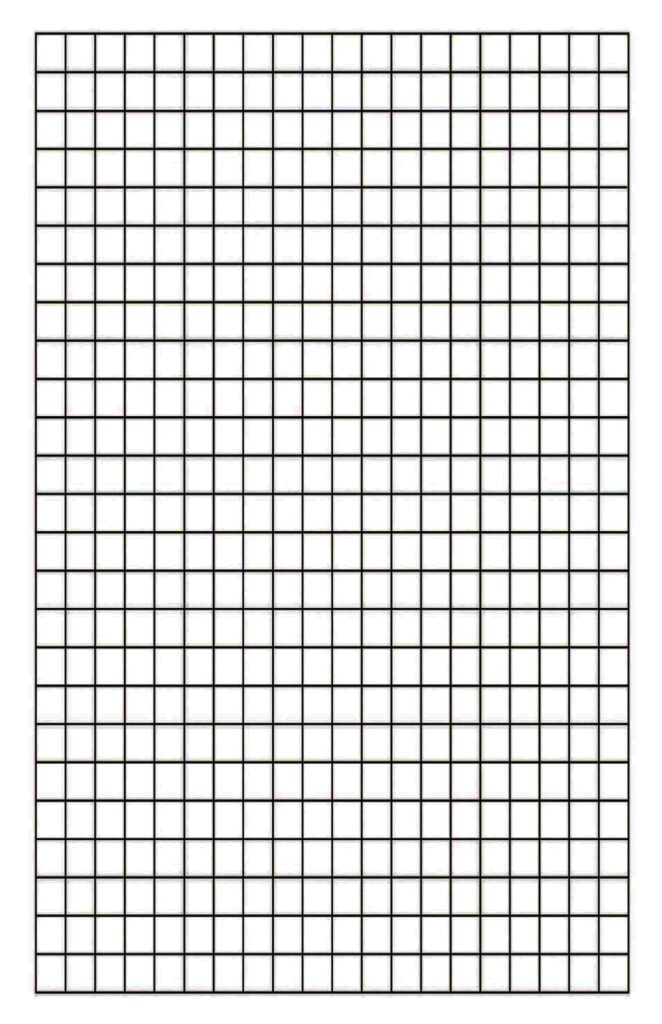
Bar graph papers comes in handy when it comes to measure the changes over time specially when the changes are large. The basic purpose of using a bar graph is to compare things between different groups or to track changes over time. The visual display of data (often grouped) in the shape of vertical or horizontal rectangular bars, with the length of the bars corresponding to the measure of the data, is called a bar graph. Bar charts are another name for them. One tool used in statistics for processing data is the bar graph.
This page is loaded with bar graph paper templates. If you are looking for the one then download it from here. A bar graph is used to represent the statistical data. If you are wondering what is statistics then please note that the collection, presentation, analysis, and interpretation of observations of data are known as statistics. Bar charts are used in mathematics and engineering concepts, therefore as a student you must be aware of them.
Read the article below to know what is a bar graph, type of bar graphs, how to draw bar graph. Also, you can download bar graph paper pdf here for free.
What is Bar Graph?
Bar graphs or bar charts are visual representations of groups of data that are made up of vertical or horizontal rectangular bars with lengths that are equal to the data’s measure.
- The bar graph makes it simple to compare various sets of data among various groups.
- Two axes are used to depict the relationship, with the discrete values on one axis and the categories on the other.
- The graph displays the key changes in the data over time.
Bar Graph Paper PDF
As you can see different type of bar graph paper templates are shared here. Each graphing paper is available for free download in pdf format. So without wasting any further time, download a templates that is suitable for your work need. Making a bar graph paper from scratch consumes a lot of time, this is why here we have shared these templates. Download a template from here to save your time and efforts.
Bar Graph Paper Printable
It is never easy to create graphs without any errors or mistakes. Plus, it requires skills and a lot of patience. Check out the graphing paper templates here that we have gathered for you all and choose the best one for your use. Our readers can easily use this paper template for the preparation of the bar graph paper.
Blank Bar Graph Paper
Bar Graph on Graph Paper
Types of Bar Graphs
There are two type of bar graphs i.e. vertical and horizontal bar graphs. The primary feature of any bar graph is its length or height.
Following are the type of bar graphs;
- Vertical bar chart
- Horizontal bar chart
Vertical Bar Graphs
Vertical bar graphs are graphs that use bars to display grouped data vertically in a chart or graph, with the bars serving as a measure of the data. The graph’s y-axis is used to display the data, and the height of the bars indicates the values.
Horizontal Bar Graphs
These graphs are known as horizontal bar graphs when the grouped data are represented horizontally in a chart with the aid of bars, with the bars displaying the measure of data. The graph’s x-axis is used to represent the data, and the length of the bars indicates the values.
How to draw a bar graph on graph paper
Follow the simple seven steps guide to make a bar graph on a graphing paper.
- Firstly you need to choose title of the bar graph.
- Then proceed to draw the horizontal axis and vertical axis.
- It’s the time to able the horizontal axis.
- Proceed to Write down the names on the horizontal axis.
- Now, label the vertical axis.
- Finalise the scale range for the given data.
- Finally, create a bar graph with the appropriate numbers to represent each category.
Now you know what is a bar graph, type of bar graph, and how to draw it as well. Not only that, you have bar graph paper templates as well available for free download in a pdf format. Download a template from here and take a print-out for your use.


